Analysis as a package
analysis-as-a-package.RmdTargets:
- Awareness: the structure of R packages offers more than simply packing new functionalities. It is also a place to share datasets and statistical analysis.
- RStudio offers functionalities supporting this approach.
1. Example use case
Lets consider an example: I need to run a statistical analysis resulting in a Sankey diagram.
In a script.R:
- prepare a dummy set of data following the Analysis Data Model (ADaM, CDISC).
- pre process the data (e.g. filter, transformations).
- obtain the graph.
# Dummy collection of ADaM datasets: ADSL and ADPASI

raw <- read.table(
  file.path(
    "https://raw.githubusercontent.com/VIS-SIG/Wonderful-Wednesdays",
    "master/data/2021/2021-04-14/WWW_SustainedResponse.csv"
  ),
  header = TRUE,
  sep = ",",
  stringsAsFactors = FALSE
)

library(tidyr)
library(dplyr)
#>
#> Attaching package: 'dplyr'
#> The following objects are masked from 'package:stats':
#>
#>     filter, lag
#> The following objects are masked from 'package:base':
#>
#>     intersect, setdiff, setequal, union
raw <- as_tibble(raw)

adsl <- raw %>%
  distinct(USUBJID, TRT, BASELINE) %>%
  mutate(
    ARMCD = factor(
      TRT,
      levels = c(
        "COMPARATOR TREATMENT",
        "ACTIVE TREATMENT DOSE 01",
        "ACTIVE TREATMENT DOSE 02"
      ),
      labels = c("ARM A", "ARM B", "ARM C")
    )
  )

adpasi <- raw %>%
  select(-TRT) %>%
  gather(key = "AVISIT", value = "AVAL", -USUBJID) %>%
  mutate(
    AVISIT = ifelse(AVISIT == "BASELINE", "WEEK00", AVISIT),
    PARAMCD = "PASITOT"
  ) %>%
  select(USUBJID, PARAMCD, AVISIT, AVAL)


# Analysis dataset preprocessing

# function: replace missing levels of a factor by "Missing"
add_missing <- function(x) {
  ll <- levels(x)
  ll <- c(ll, "Missing")
  x <- as.character(x)
  x <- ifelse(is.na(x), "Missing", x)
  factor(x, levels = ll, exclude = NULL)
}

set.seed(3)
ads <- adpasi %>%
  filter(AVISIT %in% c("WEEK00", "WEEK01", "WEEK08", "WEEK52")) %>%
  mutate(
    time = factor(AVISIT),
    rsp = cut(AVAL, breaks = 3, labels = c("Low", "Mid", "High")),
    rsp = add_missing(rsp),
    subj = gsub("^SUBJECT (.*)$", x = USUBJID, replacement = "\\1")
  ) %>%
  select(subj, time, rsp) %>%
  filter(subj %in% sample(unique(subj), 200)) %>%
  arrange(rsp, time, subj)


# Generate the graphic
library(ggalluvial)
#> Loading required package: ggplot2

color_scale <- setNames(
  viridis::viridis(4, begin = .2, end = .8, option = "C", direction = -1),
  nm = levels(ads$rsp)
)
ggplot(ads, aes(x = time, stratum = rsp, alluvium = subj, fill = rsp)) +
  geom_stratum(colour = NA) +
  geom_flow(stat = "alluvium", color = "gray85", lwd = .01) +
  scale_fill_manual(values = color_scale)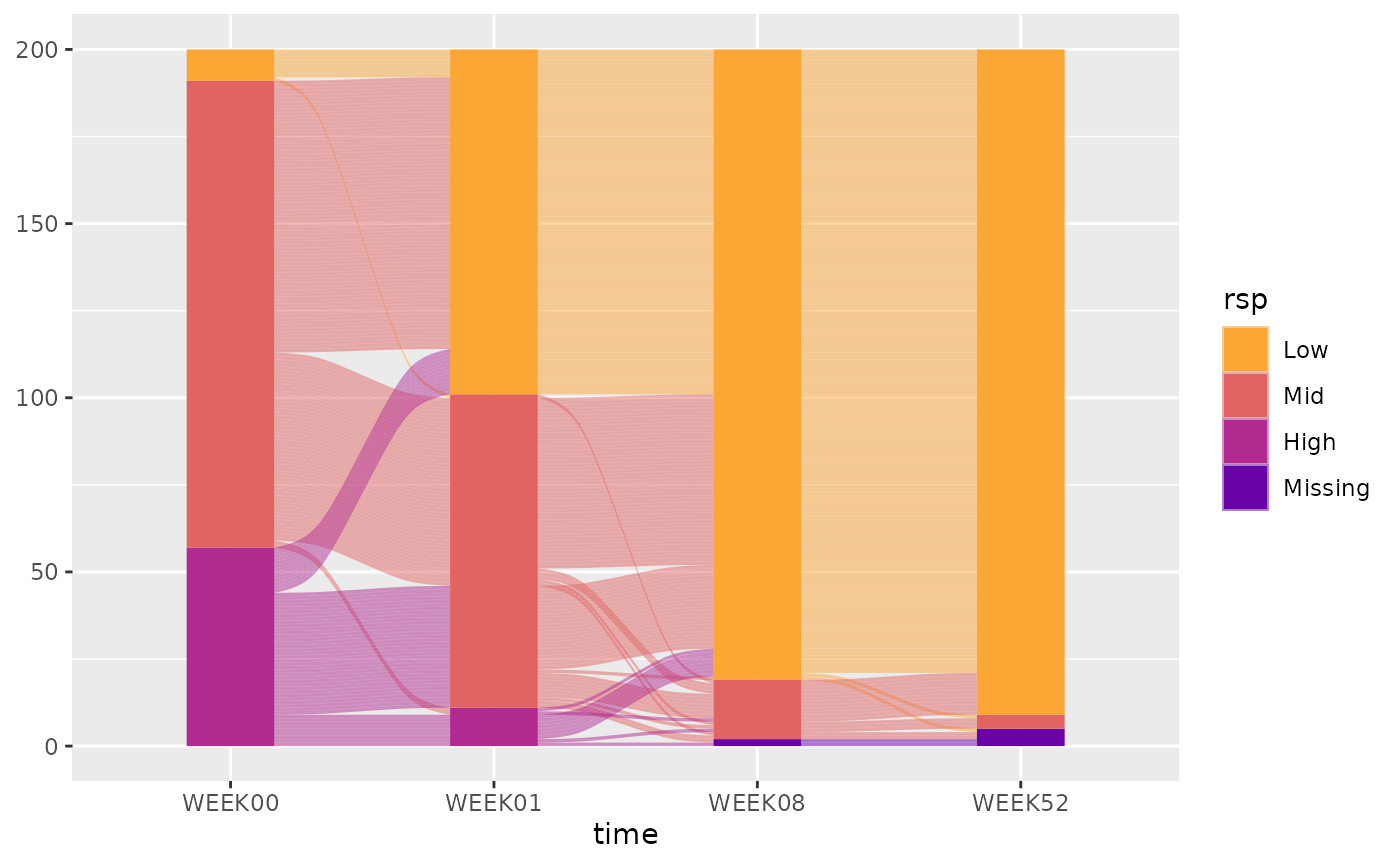
Result, it is working and:
- rely on a new function (
add_missing()).- "I will probably need that in the future for another request"
- nice to have: decide the number of subjects for the examples, could be a new function, to generate dummy data on demand.
- "That so convenient to have ready to work dummy datasets!"
- needs functions which are defined in other projects:
- "Oh! I remember, I already coded this for a previous analysis!":
-
clean_slate(): figure annotations (header, title, notes and footer). -
preview(): preview the generated pdf itself.
2. Package equivalence
2.1. Overview
Create a R project package
Either use devtools::create(), or follow the RStudio user interface in 5 clicks:
Click 1 - Create a new project
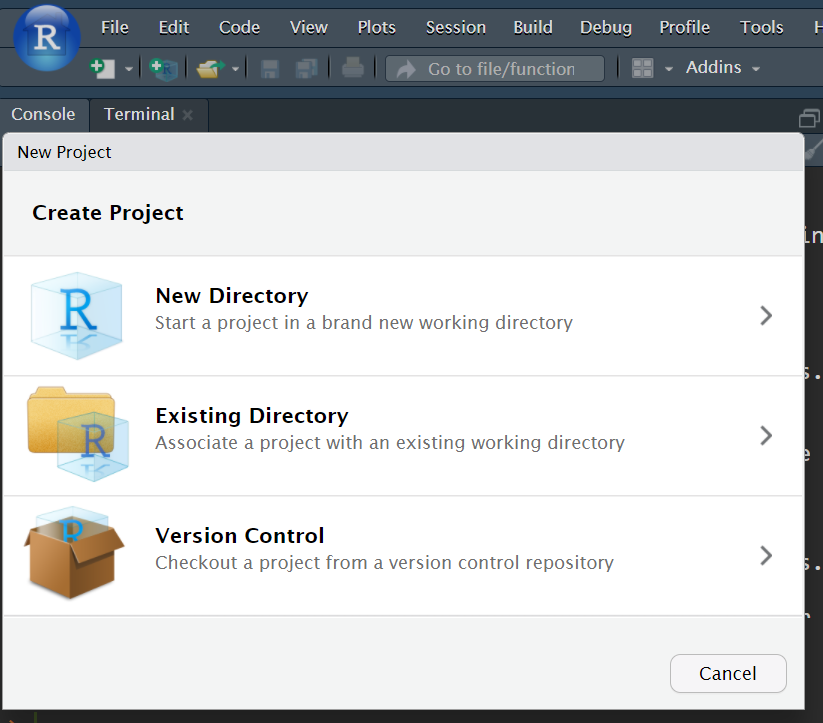
Click 2 - in a new directory
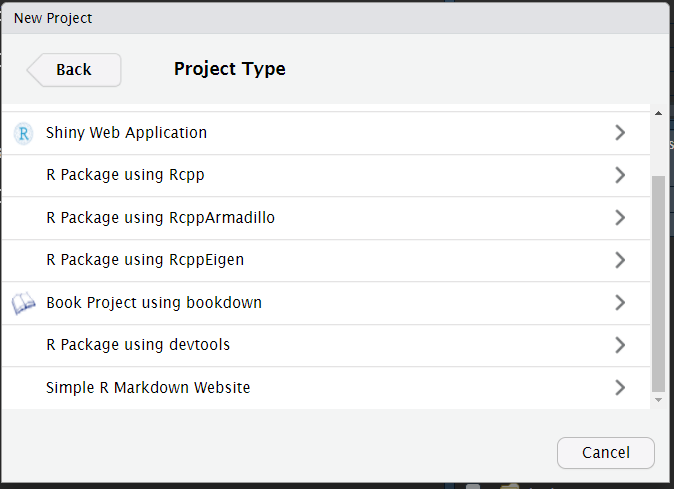
Click 3 - R Package using devtools
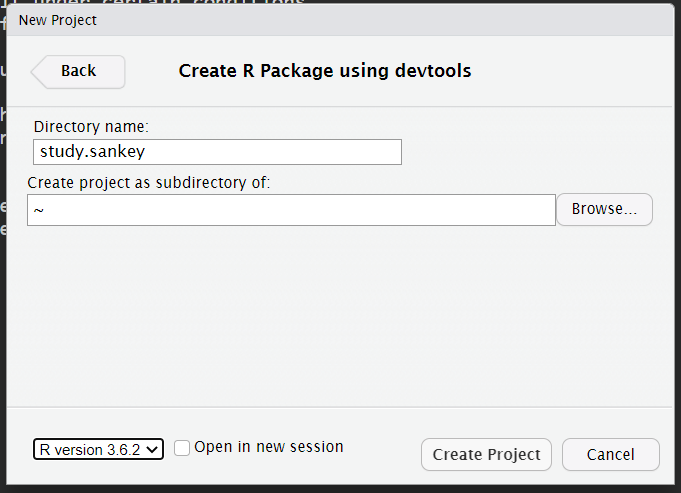
Click 4 - Create project
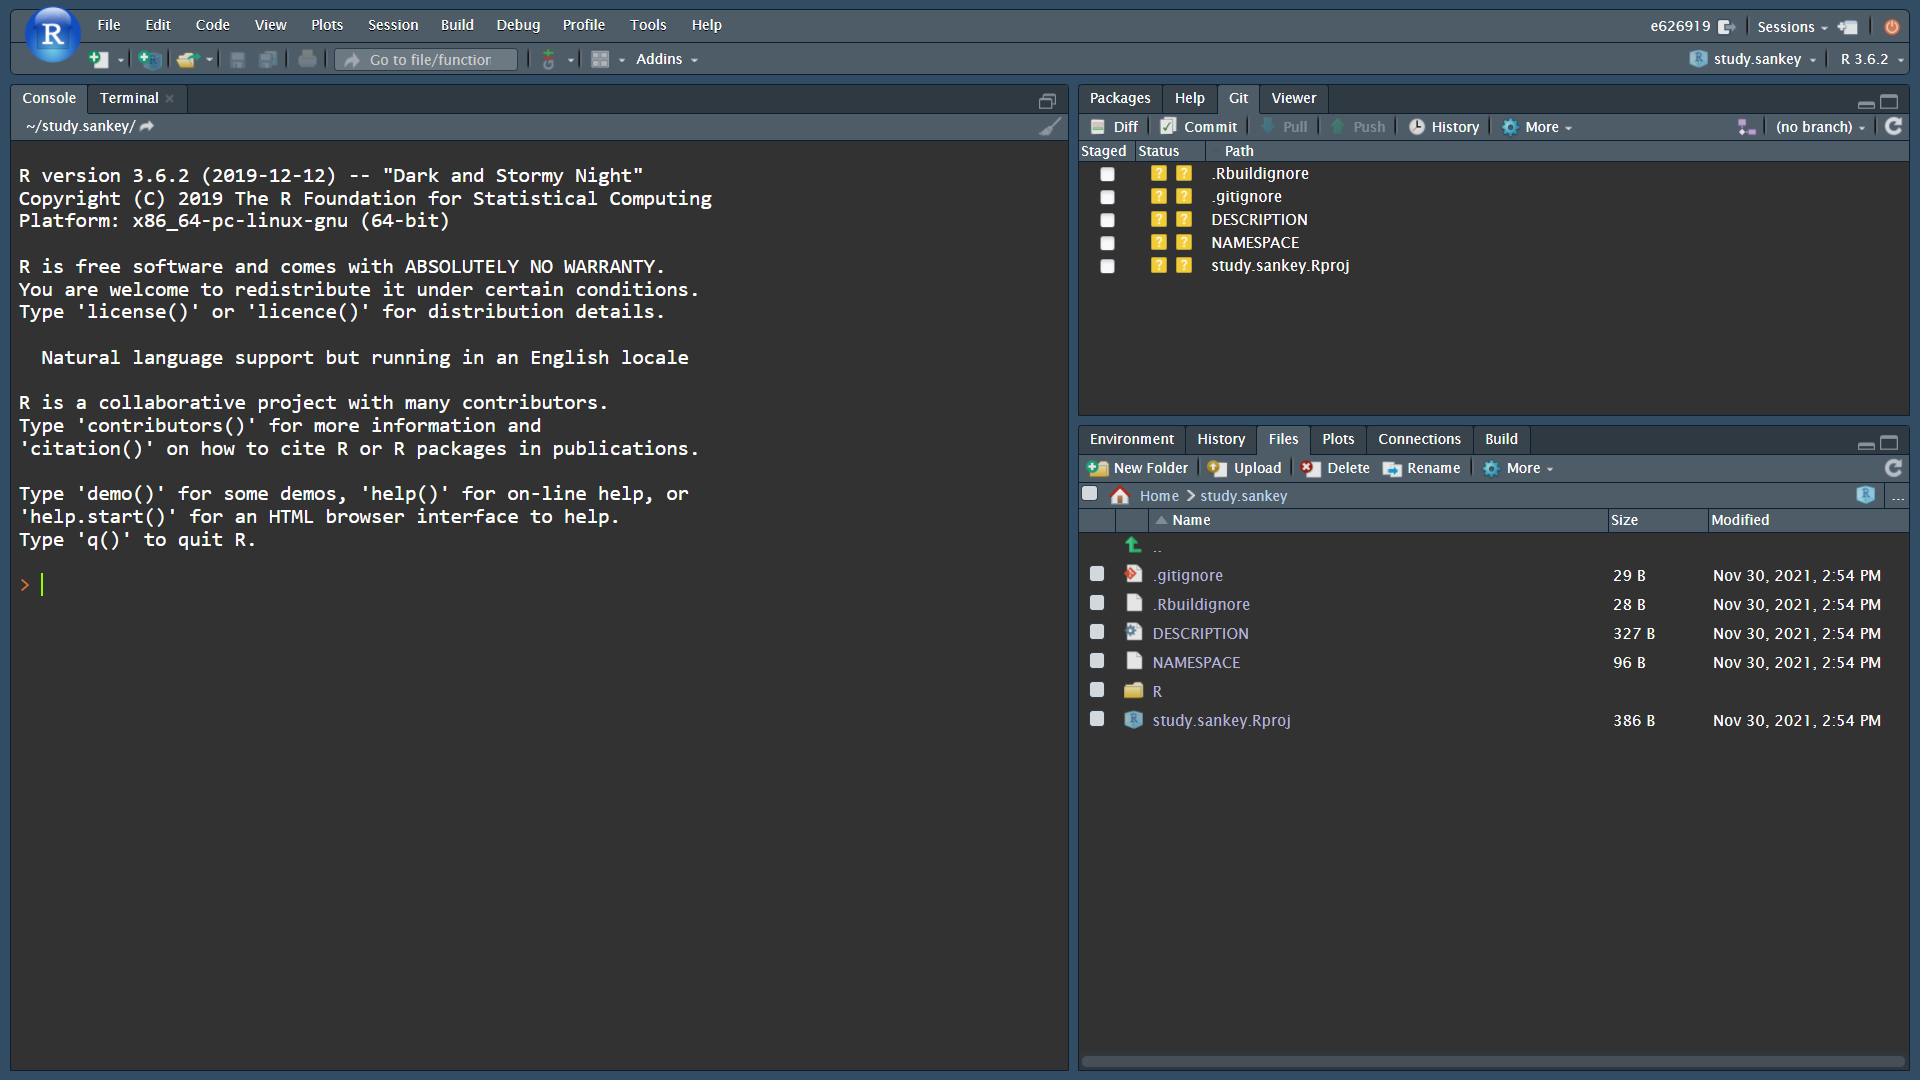
Click 5: already setup
- Move the script in
inst/, a permissive area of the package.- makes sections to enable show/hide document outline in RStudio interface, and make section knit-able for controlled execution; for instance:
- The folder
R/contains the documented functions:- a new function to create a dummy dataset from Wonderful Wednesday PASI example:
adam_ww(). - a new function to add missing data:
add_missing(), similar toaddNA(). - copy-paste function developed in other project:
preview()-
clean_slate()family.
- a new function to create a dummy dataset from Wonderful Wednesday PASI example:
The markup system roxygen2, helps making a complete documentation. Example with the function add_missing() in R/add_missing.R.
#' Factor: NA is "Missing" level
#'
#' Assign the value "Missing" to missing values of a factor. Built as [addNA()].
#'
#' @param x (`factor`)
#' @param missing_lvl (`character`)
#'
#' @export
#' @examples
#'
#' animals <- as.factor(c("cat", "dog", NA))
#' animals
#' add_missing(animals)
#'
add_missing <- function(x, missing_lvl = "Missing") {

  assertthat::assert_that(is.factor(x))

  ll <- levels(x)
  ll <- c(ll, missing_lvl)
  x <- as.character(x)
  x <- ifelse(is.na(x), missing_lvl, x)
  factor(x, levels = ll, exclude = NULL)
}
2.2. Practically
Transfering a script in a package is not a drastic change:
- keep working with
script.R - once a function is identified, write in
R/.
Frequently asked qestions:
- "Many files, will not this be complicated to find a file/function in the project?"
-
<F2>: Go to function definition.
-
- "Many files, should every file be sourced with
source()":-
devtools::load_all(): load all the package, all the function becomes available similarly to alibrary()call for an installed package (even the manual pages).
-
- "Many files, how a programmer/reviewer knows where to start?"
-
usethis::use_readme_rmd(), useknitr::read_chunk(inst/study.R)to screen the script sections, and use empty but named R code chunk to decide which section to execute, in which order. - Good because:
- there are sections needed for development only, but not for the program run (e.g. preview) while commented code is bad practice.
- room for contextual information (e.g. a decision made because of an unexpected finding).
- alternative for the Don't Repeat Yourself principle: a code chunk can be called several times. For instance, as ggplot is a framework enhancing the readability of the involved graphical layers, it is sometimes a shame to wrap a ggplot code section into a function, better to repeat its execution.
-
3 Perspectives:
Standard format comes with standard-support tools:
- R Markdown/README/RStudio: the program run is as simple as clicking on the knit button.
-
devtools:
-
<ctrl>+<shift>+<d>, equivalent todevtools::document(), updates the documentation (populates theNAMESPACEfile andman/folder). -
<ctrl>+<shift>+<e>, equivalent todevtools::check(), verifies a large number of standards (e.g. functions are well documented, dependencies are well accounted for, examples are working).
-
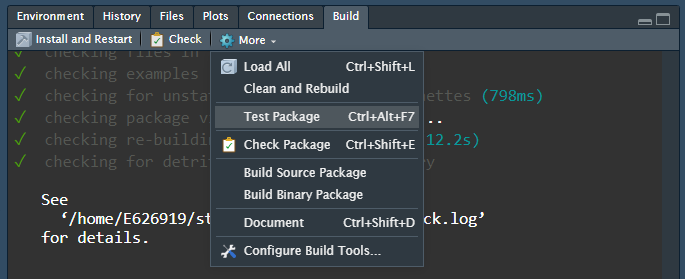
Devtools: look at the Build panel
-
lintr::lint():- helps checking the code is lint-free, clean. Helps in the adoption of good practices and standard.
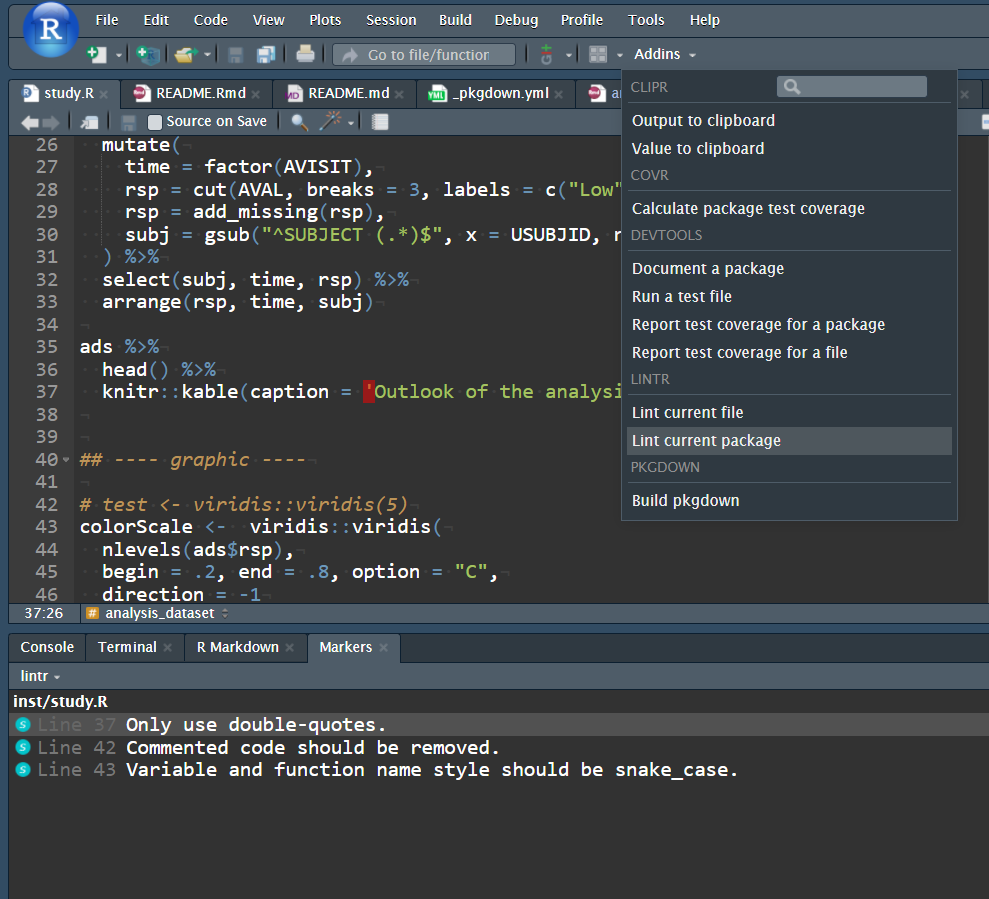
Lintr: keep-up with code quality (and proove it)
-
pkgdown:- build a website: the result
README.mdbecomes the home page, functions are documented inreference, vignette added inarticles. - all functions are cross-referenced: the link
adam_ww(), will bring you to the right page.
- build a website: the result
And much more:
- data: contains datasets, possibly along with the preprocessing code.
-
templates: complexe templates ins
inst/rmarkdown/. -
vignettes/: use (e.g. the present document). -
tests/: place for automated test (e.g. test that the ADSL data returned byadam_wwis such asUSUBJIDis the unique row identifier). - Git integration.